Test case writing techniques for dynamic testing
Equivalence partitioning
Boundary Value Analysis
Decision table
Cause and effect graph technique
State transition diagram
Orthogonal array testing(OATS)
Error guessing.
We have some really good papers 1st, 2nd and 3rd points (Equivalence portioning, BVA and decision tables) here in STH. I am going to discuss about point 4 which is Cause and effect graph.
Cause-Effect Graphing is a technique which starts with set of requirements and determines the minimum possible test cases for maximum test coverage which reduces test execution time and ultimately cost.
The goal is to reduce the total number of test cases still achieving the desired application quality by covering the necessary test cases for maximum coverage.
But at the same time obviously there are some downsides of using this test case writing technique. It takes time to model all your requirements into this cause-effect graph before writing test cases.
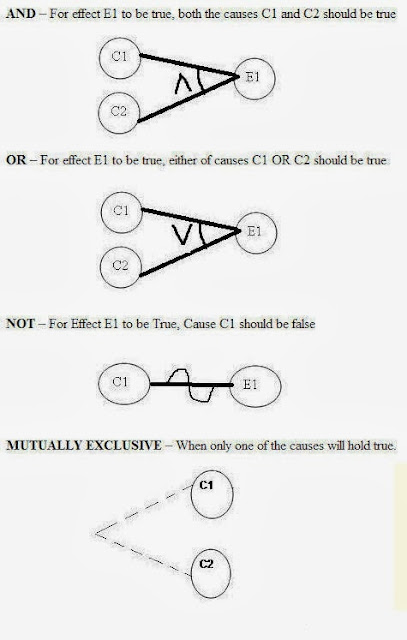
Notations we are going to use:

Now let’s try to implement this technique with some example.
1. Draw a cause and effect graph based on a requirement/situation
2. Cause and Effect graph is given, draw a decision table based on it to draw the test case.
2. Cause and Effect graph is given, draw a decision table based on it to draw the test case.
Let’s see both of them one by one.
Let’s draw a cause and effect graph based on a situation
Situation:
The “Print message” is software that read two characters and, depending of their values, messages must be printed.
- The first character must be an “A” or a “B”.
- The second character must be a digit.
- If the first character is an “A” or “B” and the second character is a digit, the file must be updated.
- If the first character is incorrect (not an “A” or “B”), the message X must be printed.
- If the second character is incorrect (not a digit), the message Y must be printed.
Solution:
The causes for this situation are:
C1 – First character is A
C2 – First character is B
C3 – Second character is a digit
C1 – First character is A
C2 – First character is B
C3 – Second character is a digit
The effects (results) for this situation are
E1 – Update the file
E2 – Print message “X”
E3 – Print message “Y”
E1 – Update the file
E2 – Print message “X”
E3 – Print message “Y”
LET’S START!!
First draw the causes and effects as shown below:
Key – Always go from effect to cause (left to right). That means, to get effect “E” ,what causes should be true.
In this example, let’s start with Effect E1.
Effect E1 is to update the file. The file is updated when
- First character is “A” and second character is a digit
- First character is “B” and second character is a digit
- First character can either be “A” or “B” and cannot be both.
- First character is “A” and second character is a digit
- First character is “B” and second character is a digit
- First character can either be “A” or “B” and cannot be both.
Now let’s put these 3 points in symbolic form:
For E1 to be true – following are the causes:
- C1 and C3 should be true
- C2 and C3 should be true
- C1 and C2 cannot be true together. This means C1 and C2 ae mutually exclusive.
- C1 and C3 should be true
- C2 and C3 should be true
- C1 and C2 cannot be true together. This means C1 and C2 ae mutually exclusive.
Now let’s draw this:
So as per the above diagram, for E1 to be true the condition is
(C1 C2)
C2)  C3
C3
(C1
The circle in the middle is just an interpretation of the middle point to make the graph less messy.
There is a third condition where C1 and C2 are mutually exclusive. So the final graph for effect E1 to be true is shown below:
There is a third condition where C1 and C2 are mutually exclusive. So the final graph for effect E1 to be true is shown below:
Lets move to Effect E2:
E2 states to print message “X”. Message X will be printed when First character is neither A nor B.
Which means Effect E2 will hold true when either C1 OR C2 is invalid. So the graph for Effect E2 is shown as (In blue line)
E2 states to print message “X”. Message X will be printed when First character is neither A nor B.
Which means Effect E2 will hold true when either C1 OR C2 is invalid. So the graph for Effect E2 is shown as (In blue line)
------------
For Effect E3.
E3 states to print message “Y”. Message Y will be printed when Second character is incorrect.
Which means Effect E3 will hold true when C3 is invalid. So the graph for Effect E3 is shown as (In Green line)
E3 states to print message “Y”. Message Y will be printed when Second character is incorrect.
Which means Effect E3 will hold true when C3 is invalid. So the graph for Effect E3 is shown as (In Green line)
This completes the Cause and Effect graph for the above situation.
Now let’s move to draw the Decision table based on the above graph.
Writing Decision table based on Cause and Effect graph
First write down the Causes and Effects in a single column shown below
Key is the same. Go from bottom to top which means traverse from effect to cause.
Start with Effect E1. For E1 to be true, the condition is: (C1 C2) C3 .
Here we are representing True as 1 and False as 0
Here we are representing True as 1 and False as 0
First put Effect E1 as True in the next column as
Now for E1 to be “1” (true), we have the below two conditions –
C1 AND C3 will be true
C2 AND C3 will be true
C1 AND C3 will be true
C2 AND C3 will be true
For E2 to be True, either C1 or C2 has to be false shown as
For E3 to be true, C3 should be false.
So it’s done. Let’s complete the graph by adding 0 in the blank column and including the test case identifier.
Writing Test cases from the decision table
I am writing a sample test case for test case 1 (TC1) and Test Case 2 (TC2).

In a similar fashion, you can create other test cases.
(A test case contains many other attributes like preconditions, test data, severity, priority, build, version, release, environment etc. I assume all these attributes to be included when you write the test cases in actual situation)
Conclusion
Summarizing the steps once again:
- Draw the circles for Causes and Graphs
- Start from effects and move towards the cause.
- Look for mutually exclusive causes.
This finishes the Cause and Effect graph dynamic test case writing technique. We have seen how to draw the graph and how to draw the decision table based on it. The final step of writing test cases based on decision table is comparatively easy.
About the Author: This is a article by Shilpa Chatterjee Roy. She is working in software testing field for the past 8.5 years in various domains.I have mad some minor changes to suite our context.
Informative post, Thanks for sharing the software testing techniques.
ReplyDeleteRegards,
Software testing training|Software training
Thank you for the nice article here. Really nice and keep update to explore more gaming tips and ideas.
ReplyDeleteAR/VR Game Testing
Gameplay Testing Services
Video Game Testing Company
Thanks for the posts.
Delete