Sunday, December 15, 2013

Top 5 Performance Testing Tools – Comprehensive List of In-Demand Tools with Download Link

  • Apache JMeter
  • NeoLoad
  • LoadRunner
  • LoadUI
  • WebLOAD

1. Apache JMeter

Apache JMeter
DescriptionOpen source load testing tool: It is a Java platform application. It is mainly considered as a performance testing tool and it can also be integrated with the test plan. In addition to the load test plan, you can also create a testplan.  This tool has the capacity to be loaded into a server or network so as to check on its performance and analyze its working under different conditions. Initially, it was introduced for testing the web applications, but later its scope had widened.   It is of great use in testing the functional performance of the resources such as Servlets, Perl Scripts and JAVA objects.  Need JVM 1.4 or higher to run.
Apache JMeter System Requirements: It works under Unix and Windows OS
Download link: Apache JMeter download

2. NeoLoad

NeoLoad
DescriptionLoad and performance testing software: This is a tool used for measuring and analyzing the performance of the website. The performance and the end result can be evaluated by using this tool and any further steps can be taken. This helps you in improving and optimizing the performance of your web application. This tool analysis the performance of the web application by increasing the traffic to the website and the performance under heavy load can be determined. You can get to know the capacity of the application and the amount of users it can handle at the same time. This tool was developed by a French company named as Netosys and it was written in JAVA.  It is available in two different languages; English and French.
NeoLoad System Requirements:  This tool is compatible on operating systems like Microsoft windows, Linux and Solaris.
Download link: NeoLoad download

3. LoadRunner

LoadRunner
Description: This is a HP product which can be used as a performance testing tool.  This can be bought as a HP product from its HP software division.  Also, it is very much useful in understanding and determining the performance and outcome of the system when there is actual load. One of the key attractive features of this testing tool is that, it can create and handle thousands of users at the same time. This tool enables you to gather all the required information with respect to the performance and also based on the infrastructure.  The LoadRunner comprises of different tools; namely, Virtual User Generator, Controller, Load Generator and Analysis.
LoadRunner System Requirements: Microsoft Windows and Linux are the favourable OS for this measuring tool.
Download linkLoadRunner download  

4. LoadUI

LoadUI
Description: Open Source Stress Testing Tool: Load UI is yet another open source and load testing software used for measuring the performance of the web applications. This tool works effectively when it is integrated with the functional testing tool soapUI. LoadUI is the most flexible and interactive testing tools. This allows you to create, configure and update your tests while the application is being tested. It also gives a visual Aid for the user with a drag and drop experience. This is not a static performance tool. The advanced analysis and report generating features allows you to examine the actual performance by pumping in new data even while the application is being tested. You need not bother to restart the LoadUI each and every time you modify or change the application. It automatically gets updated in the interface.
System Requirements: Cross platform.
Price: This tool being a open source application, it is available for free and everyone can have the easy access to its full source code.
Download link: LoadUI download  

5. WebLOAD

WebLOAD
Description: Load testing and stress testing tool for web application: To find out the bottlenecks of the website, it is necessary to examine the pros and cons. There are many performance testing tools available for measuring the performance of the certain web application. WebLoad is one such tool used for load testing and stress testing. This tool can be used for Load testing any internet applications such as Ajax, Adobe Flex, Oracle Forms and much more. Through this tool, you have the ability to measure the working performance and also its response to the users. This was developed by the Radview Software for the applicaion Tesing.  This tool was a famous and award fetching software of the Radview Software. This tool is widely used in the environment where there is a high demand for maximum Load testing. This tool gives you a clear information on the functionality and the actual capacity of the web applications.
WebLOAD System Requirements: Cross Platform.
Download link: WebLOAD download

Tuesday, December 10, 2013

Test case writing techniques for dynamic testing-cause effect Graph

Test case writing techniques for dynamic testing

Equivalence partitioning
Boundary Value Analysis
Decision table
Cause and effect graph technique
State transition diagram
Orthogonal array testing(OATS)
Error guessing.

We have some really good papers 1st, 2nd and 3rd points (Equivalence portioning, BVA and decision tables) here in STH. I am going to discuss about point 4 which is Cause and effect graph.

Cause-Effect Graphing is a technique which starts with set of requirements and determines the minimum possible test cases for maximum test coverage which reduces test execution time and ultimately cost.
The goal is to reduce the total number of test cases still achieving the desired application quality by covering the necessary test cases for maximum coverage.
But at the same time obviously there are some downsides of using this test case writing technique. It takes time to model all your requirements into this cause-effect graph before writing test cases.
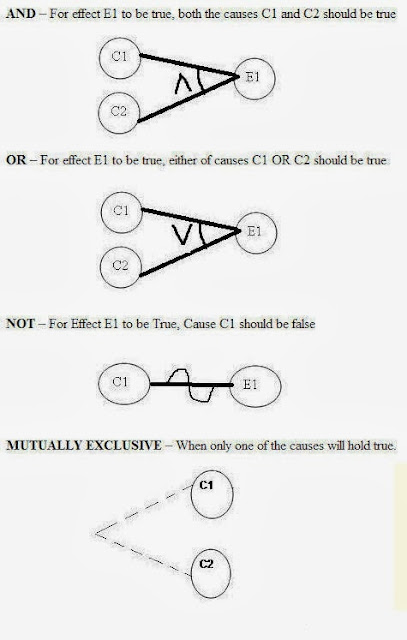
Notations we are going to use:

Now let’s try to implement this technique with some example.
1. Draw a cause and effect graph based on a requirement/situation
2. Cause and Effect graph is given, draw a decision table based on it to draw the test case.
Let’s see both of them one by one.

Let’s draw a cause and effect graph based on a situation

Situation:
The “Print message” is software that read two characters and, depending of their values, messages must be printed.
  • The first character must be an “A” or a “B”.
  • The second character must be a digit.
  • If the first character is an “A” or “B” and the second character is a digit, the file must be updated.
  • If the first character is incorrect (not an “A” or “B”), the message X must be printed.
  • If the second character is incorrect (not a digit), the message Y must be printed.
Solution:
The causes for this situation are:
C1 – First character is A
C2 – First character is B
C3 – Second character is a digit
The effects (results) for this situation are
E1 – Update the file
E2 – Print message “X”
E3 – Print message “Y”
LET’S START!!
First draw the causes and effects as shown below:
Cause and effect graph testing 2
Key – Always go from effect to cause (left to right). That means, to get effect “E” ,what causes should be true.
In this example, let’s start with Effect E1.
Effect E1 is to update the file. The file is updated when
-  First character is “A” and second character is a digit
-  First character is “B” and second character is a digit
-  First character can either be “A” or “B” and cannot be both.
Now let’s put these 3 points in symbolic form:
For E1 to be true – following are the causes:
-  C1 and C3 should be true
-  C2 and C3 should be true
-  C1 and C2 cannot be true together. This means C1 and C2 ae mutually exclusive.
Now let’s draw this:
Cause and effect graph testing 3
So as per the above diagram, for E1 to be true the condition is
(C1  1C2) 2 C3
The circle in the middle is just an interpretation of the middle point to make the graph less messy.
There is a third condition where C1 and C2 are mutually exclusive. So the final graph for effect E1 to be true is shown below:
Cause and effect graph testing 4
Lets move to Effect E2:
E2 states to print message “X”. Message X will be printed when First character is neither A nor B.
Which means Effect E2 will hold true when either C1 OR C2 is invalid. So the graph for Effect E2 is shown as (In blue line)
Cause and effect graph testing 5
------------
For Effect E3.
E3 states to print message “Y”. Message Y will be printed when Second character is incorrect.
Which means Effect E3 will hold true when C3 is invalid. So the graph for Effect E3 is shown as (In Green line)
Cause and effect graph testing 6
This completes the Cause and Effect graph for the above situation.
Now let’s move to draw the Decision table based on the above graph.

Writing Decision table based on Cause and Effect graph

First write down the Causes and Effects in a single column shown below
Cause and effect graph testing 7
Key is the same. Go from bottom to top which means traverse from effect to cause.
Start with Effect E1. For E1 to be true, the condition is: (C1 1 C2) 2 C3 .
Here we are representing True as 1 and False as 0
First put Effect E1 as True in the next column as
Cause and effect graph testing 8
Now for E1 to be “1” (true), we have the below two conditions –
C1 AND C3 will be true
C2 AND C3 will be true
Cause and effect graph testing 9
For E2 to be True, either C1 or C2 has to be false shown as
Cause and effect graph testing 10
For E3 to be true, C3 should be false.
Cause and effect graph testing 11
So it’s done. Let’s complete the graph by adding 0 in the blank column and including the test case identifier.
Cause and effect graph testing 12

Writing Test cases from the decision table

I am writing a sample test case for test case 1 (TC1) and Test Case 2 (TC2).
Cause and effect graph testing 13
In a similar fashion, you can create other test cases.
(A test case contains many other attributes like preconditions, test data, severity, priority, build, version, release, environment etc. I assume all these attributes to be included when you write the test cases in actual situation)

Conclusion

Summarizing the steps once again:
  1. Draw the circles for Causes and Graphs
  2. Start from effects and move towards the cause.
  3. Look for mutually exclusive causes.
This finishes the Cause and Effect graph dynamic test case writing technique. We have seen how to draw the graph and how to draw the decision table based on it. The final step of writing test cases based on decision table is comparatively easy.
About the Author: This is a  article by Shilpa Chatterjee Roy. She is working in software testing field for the past 8.5 years in various domains.I have mad some minor changes to suite our context.